> ## Documentation Index
> Fetch the complete documentation index at: https://nuntly.com/docs/llms.txt
> Use this file to discover all available pages before exploring further.
# Sending observability
> Track your email delivery performance — delivery rates, bounce rates, complaint rates, and email flow visualization.
The **Sending** tab of the [observability dashboard](/docs/guides/observability) provides a comprehensive view of your email delivery performance over the last 30 days.
## Email delivery
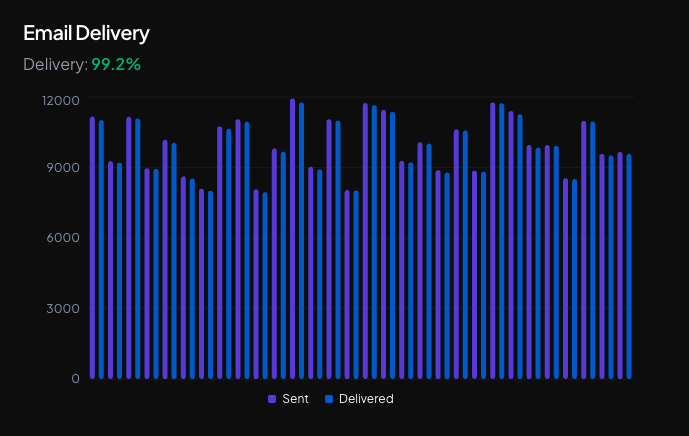
A bar chart showing sent and delivered emails over time, with the overall delivery rate.
 ## Email flow
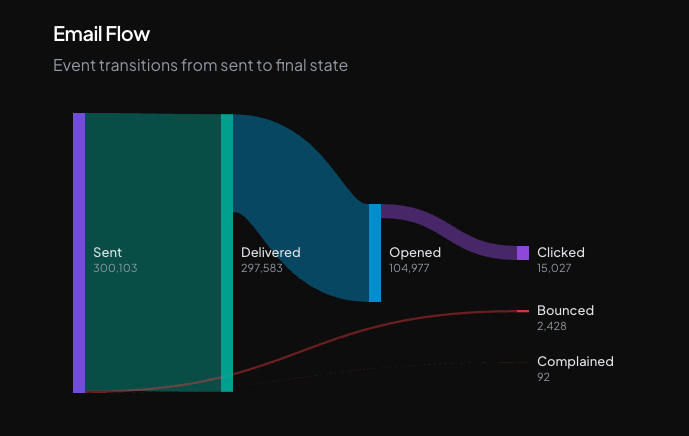
A Sankey diagram visualizing the complete flow of emails from sent to their final states (delivered, bounced, complained) and engagement events (opened, clicked).
## Email flow
A Sankey diagram visualizing the complete flow of emails from sent to their final states (delivered, bounced, complained) and engagement events (opened, clicked).
 ## Bounce rate
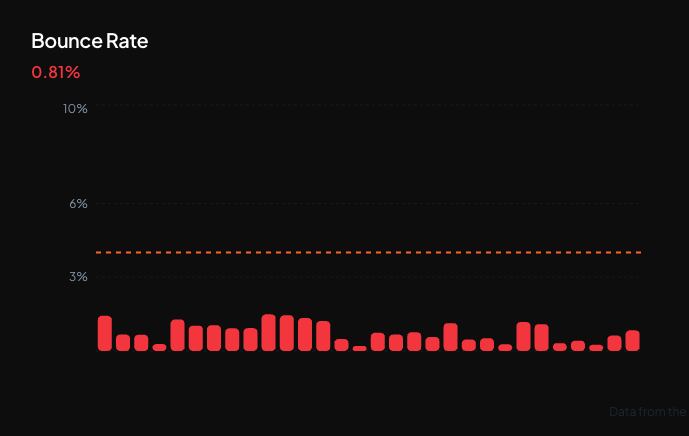
A bar chart showing daily bounce rates with a `4%` threshold reference line. Hover over the rate to see the total number of bounces over emails sent.
## Bounce rate
A bar chart showing daily bounce rates with a `4%` threshold reference line. Hover over the rate to see the total number of bounces over emails sent.
 ### Understanding bounce rate
The bounce rate is the percentage of emails that could not be delivered to the recipient's inbox. Bounces occur when an email address is invalid, the mailbox is full, or the recipient's server rejects the message.
Keep your bounce rate below `4%`. A high bounce rate damages your sender reputation and may result in suspension of your sending domain or account.
## Complaint rate
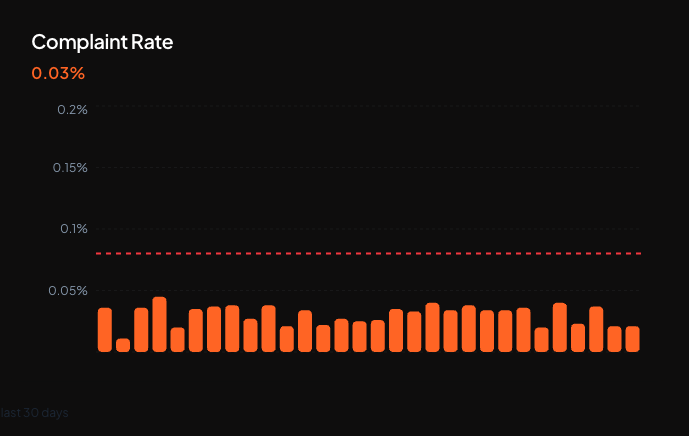
A bar chart showing daily complaint rates with a `0.08%` threshold reference line. Hover over the rate to see the total number of complaints over emails delivered.
### Understanding bounce rate
The bounce rate is the percentage of emails that could not be delivered to the recipient's inbox. Bounces occur when an email address is invalid, the mailbox is full, or the recipient's server rejects the message.
Keep your bounce rate below `4%`. A high bounce rate damages your sender reputation and may result in suspension of your sending domain or account.
## Complaint rate
A bar chart showing daily complaint rates with a `0.08%` threshold reference line. Hover over the rate to see the total number of complaints over emails delivered.
 ### Understanding complaint rate
The complaint rate is the percentage of delivered emails that recipients marked as spam. Even a small number of complaints can harm your sender reputation, as email providers use complaint rates as a key signal to filter or block future messages.
Keep your complaint rate below `0.08%`. Exceeding this threshold may result in suspension of your sending domain or account.
## Learn more
All observability views at a glance
Configure your domain and enable open and click tracking
### Understanding complaint rate
The complaint rate is the percentage of delivered emails that recipients marked as spam. Even a small number of complaints can harm your sender reputation, as email providers use complaint rates as a key signal to filter or block future messages.
Keep your complaint rate below `0.08%`. Exceeding this threshold may result in suspension of your sending domain or account.
## Learn more
All observability views at a glance
Configure your domain and enable open and click tracking